목차
1. 데이터 설명 및 보기
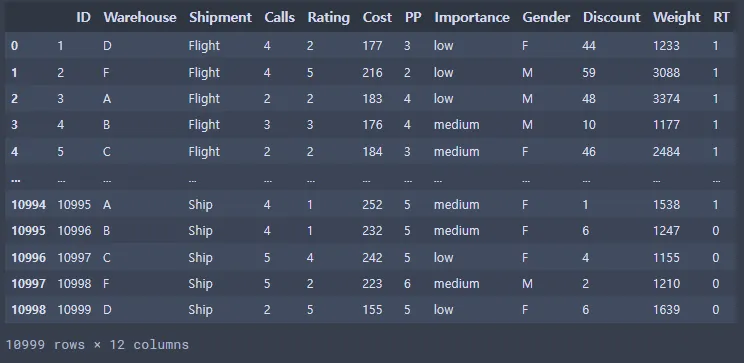
1-1. 데이터 불러오기
•
변수 정보
1.
ID : 소비자의 ID
2.
Warehouse block : A, B, C, D, E 로 구역이 나뉘어진 창고
3.
Mode of shipment : Ship, Flight, Road와 같은 운송방법
4.
Customer care calls : 배송 조회 문의 전화 건수
5.
Customer rating : 고객으로부터 받은 별점. 1(최악) ~ 5(최고)
6.
Cost of the product : 제품의 미국 달러 가격
7.
Prior purchases : 이전 구매 횟수
8.
Product importance : 낮음, 중간, 높음과 같은 다양한 매개 변수로 제품을 분류함
9.
Gender : Male, Female로 구분
10.
Discount offered : 특정 제품에 대한 할인 정도
11.
Weight in gms : 그램 단위의 무게
12.
Reached on time : 대상 변수. 1은 제품이 정시에 도달하지 않았 음을 나타내고 0은 정시에 도달했음을 나타냄.
import pandas as pd
import matplotlib as mpl
import matplotlib.pylab as plt
import seaborn as sns
import numpy as np
file_path = 'Shipping/Train.csv'
ec_data = pd.read_csv(file_path)
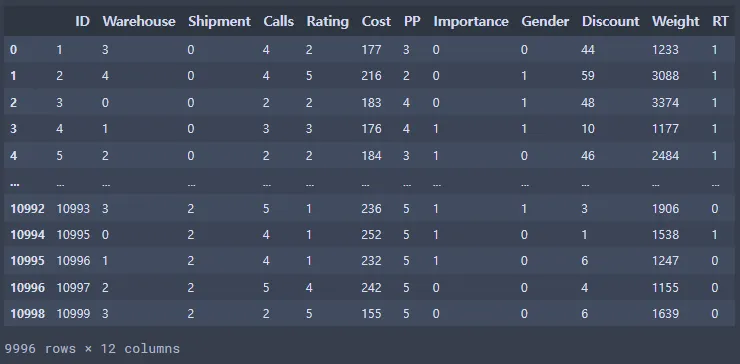
ec_data
Python
복사
1-2. 데이터 백업
ec_data_copy_backup = ec_data.copy()
ec_data.to_csv('Shipping/Train.csv')
file_path = 'Shipping/Train.csv'
ec_data_csv_backup = pd.read_csv(file_path)
ec_data_csv_backup.drop(['Unnamed: 0'], axis = 1, inplace = True)
ec_data_csv_backup
Python
복사
ec_data.info()
Python
복사
<class 'pandas.core.frame.DataFrame'>
RangeIndex: 10999 entries, 0 to 10998
Data columns (total 12 columns):
# Column Non-Null Count Dtype
--- ------ -------------- -----
0 ID 10999 non-null int64
1 Warehouse_block 10999 non-null object
2 Mode_of_Shipment 10999 non-null object
3 Customer_care_calls 10999 non-null int64
4 Customer_rating 10999 non-null int64
5 Cost_of_the_Product 10999 non-null int64
6 Prior_purchases 10999 non-null int64
7 Product_importance 10999 non-null object
8 Gender 10999 non-null object
9 Discount_offered 10999 non-null int64
10 Weight_in_gms 10999 non-null int64
11 Reached.on.Time_Y.N 10999 non-null int64
dtypes: int64(8), object(4)
memory usage: 1.0+ MB
Plain Text
복사
Warehouse_block, Mode_of_Shipment, Product_importance, Gender 가 object형을 가짐
ec_data.describe()
Python
복사
2. 데이터 기초 분석 및 탐색
2-1. 데이터 재구조화
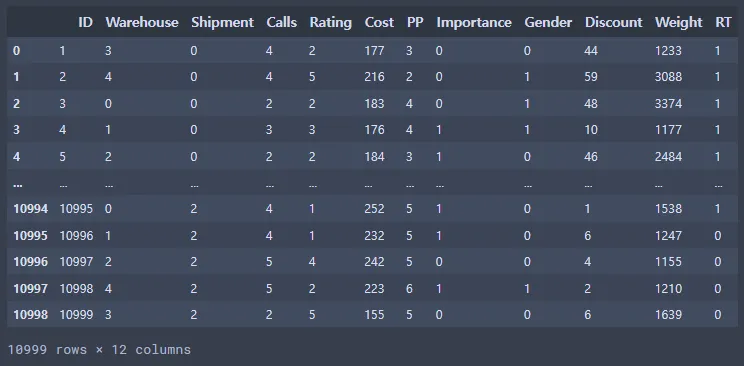
ec_data1 = ec_data.rename({'Warehouse_block':'Warehouse', 'Mode_of_Shipment':'Shipment', 'Customer_care_calls':'Calls', 'Customer_rating':'Rating', 'Cost_of_the_Product':'Cost', 'Prior_purchases':'PP', 'Product_importance':'Importance', 'Discount_offered':'Discount', 'Weight_in_gms':'Weight', 'Reached.on.Time_Y.N':'RT'}, axis = 'columns')
ec_data1
Python
복사
변수 이름 간략화
ec_data1.groupby(['Warehouse']).mean()
Python
복사
warehouse_dict = {'A':0, 'B':1, 'C':2, 'D':3, 'F':4}
ec_data1['Warehouse'] = ec_data1['Warehouse'].map(warehouse_dict)
Python
복사
위 변수 목록에 있는 E는 없고 F가 있어서 E대신 F를 4의 값으로 변환함.
ec_data1.groupby(['Shipment']).mean()
Python
복사
shipment_dict = {'Flight':0, 'Road':1, 'Ship':2}
ec_data1['Shipment'] = ec_data1['Shipment'].map(shipment_dict)
Python
복사
ec_data1.groupby(['Importance']).mean()
Python
복사
importance_dict = {'low':0, 'medium':1, 'high':2}
ec_data1['Importance'] = ec_data1['Importance'].map(importance_dict)
Python
복사
ec_data1.groupby(['Gender']).mean()
Python
복사
gender_dict = {'F':0, 'M':1}
ec_data1['Gender'] = ec_data1['Gender'].map(gender_dict)
Python
복사
ec_data1
Python
복사
ec_data1.info()
Python
복사
<class 'pandas.core.frame.DataFrame'>
RangeIndex: 10999 entries, 0 to 10998
Data columns (total 12 columns):
# Column Non-Null Count Dtype
--- ------ -------------- -----
0 ID 10999 non-null int64
1 Warehouse 10999 non-null int64
2 Shipment 10999 non-null int64
3 Calls 10999 non-null int64
4 Rating 10999 non-null int64
5 Cost 10999 non-null int64
6 PP 10999 non-null int64
7 Importance 10999 non-null int64
8 Gender 10999 non-null int64
9 Discount 10999 non-null int64
10 Weight 10999 non-null int64
11 RT 10999 non-null int64
dtypes: int64(12)
memory usage: 1.0 MB
Plain Text
복사
3. 데이터 클린징
3-1. 결측치
import missingno as msno
ec_data1.isnull().sum()
Python
복사
ID 0
Warehouse 0
Shipment 0
Calls 0
Rating 0
Cost 0
PP 0
Importance 0
Gender 0
Discount 0
Weight 0
RT 0
dtype: int64
Plain Text
복사
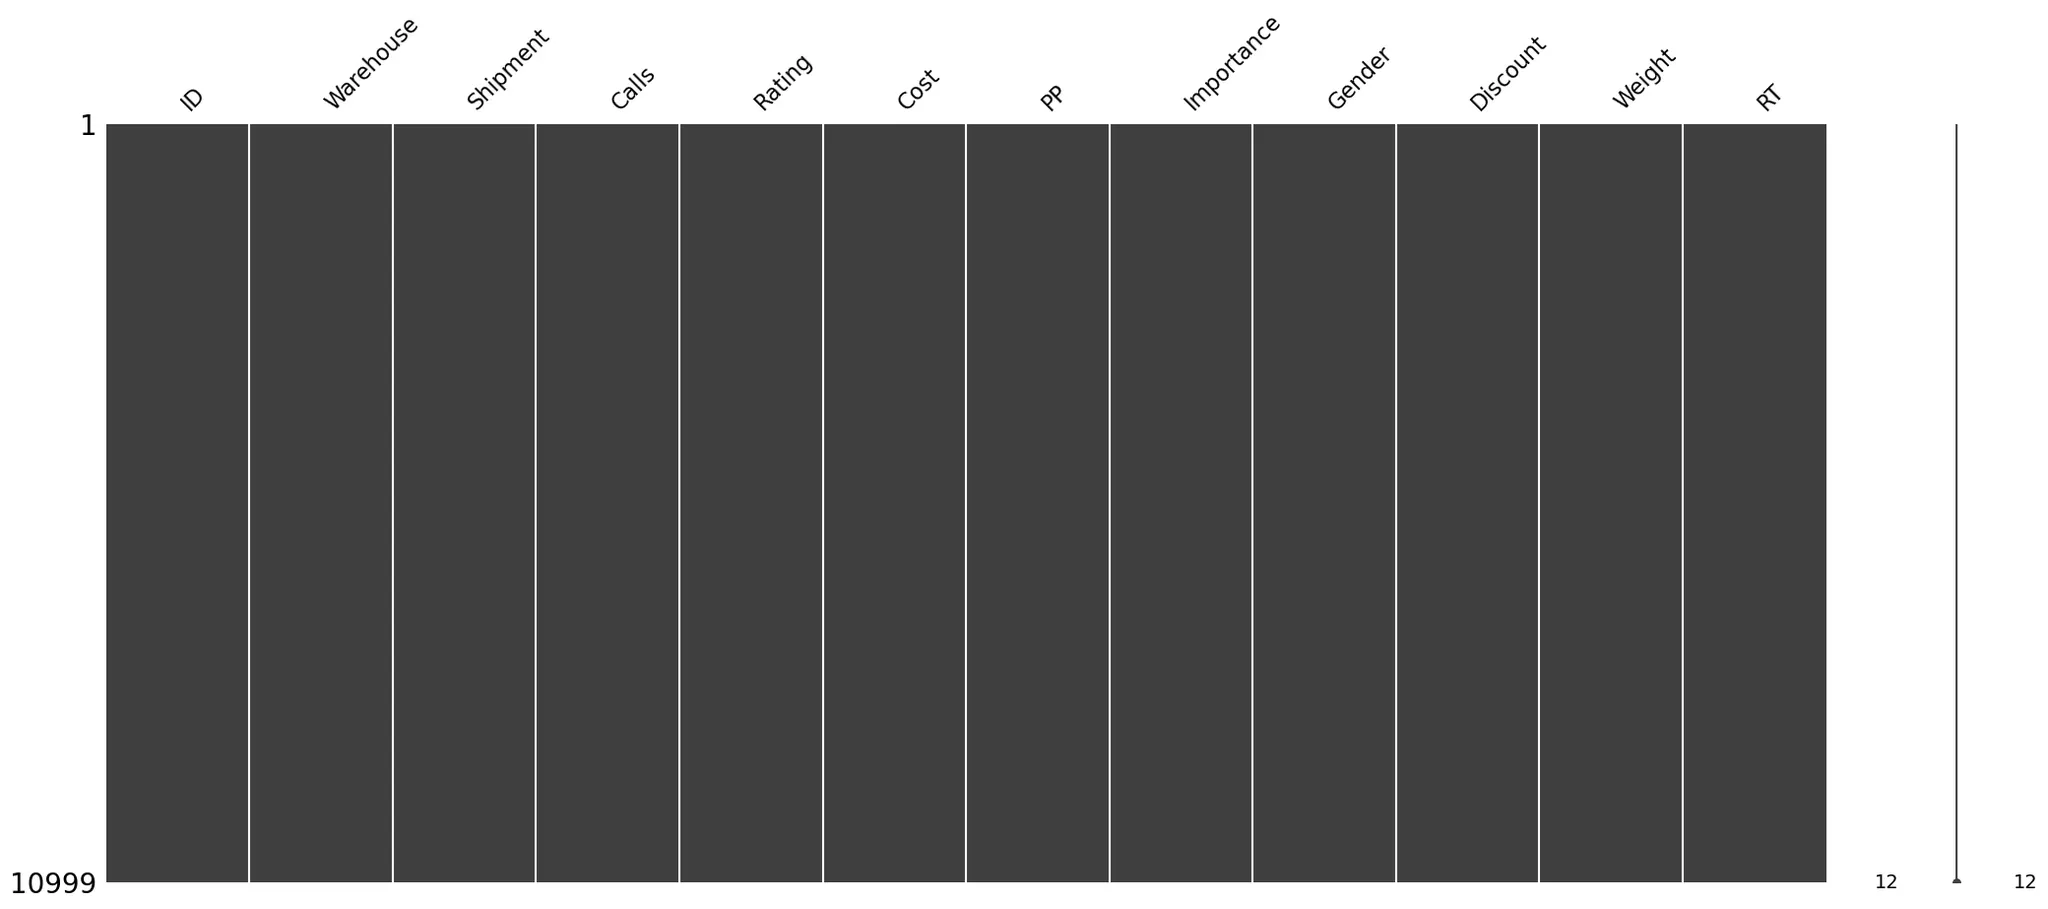
결측치 없음
msno.matrix(ec_data1)
Python
복사
모두 정수형이라 정수형 변환도 필요없다.
3-2. 이상치
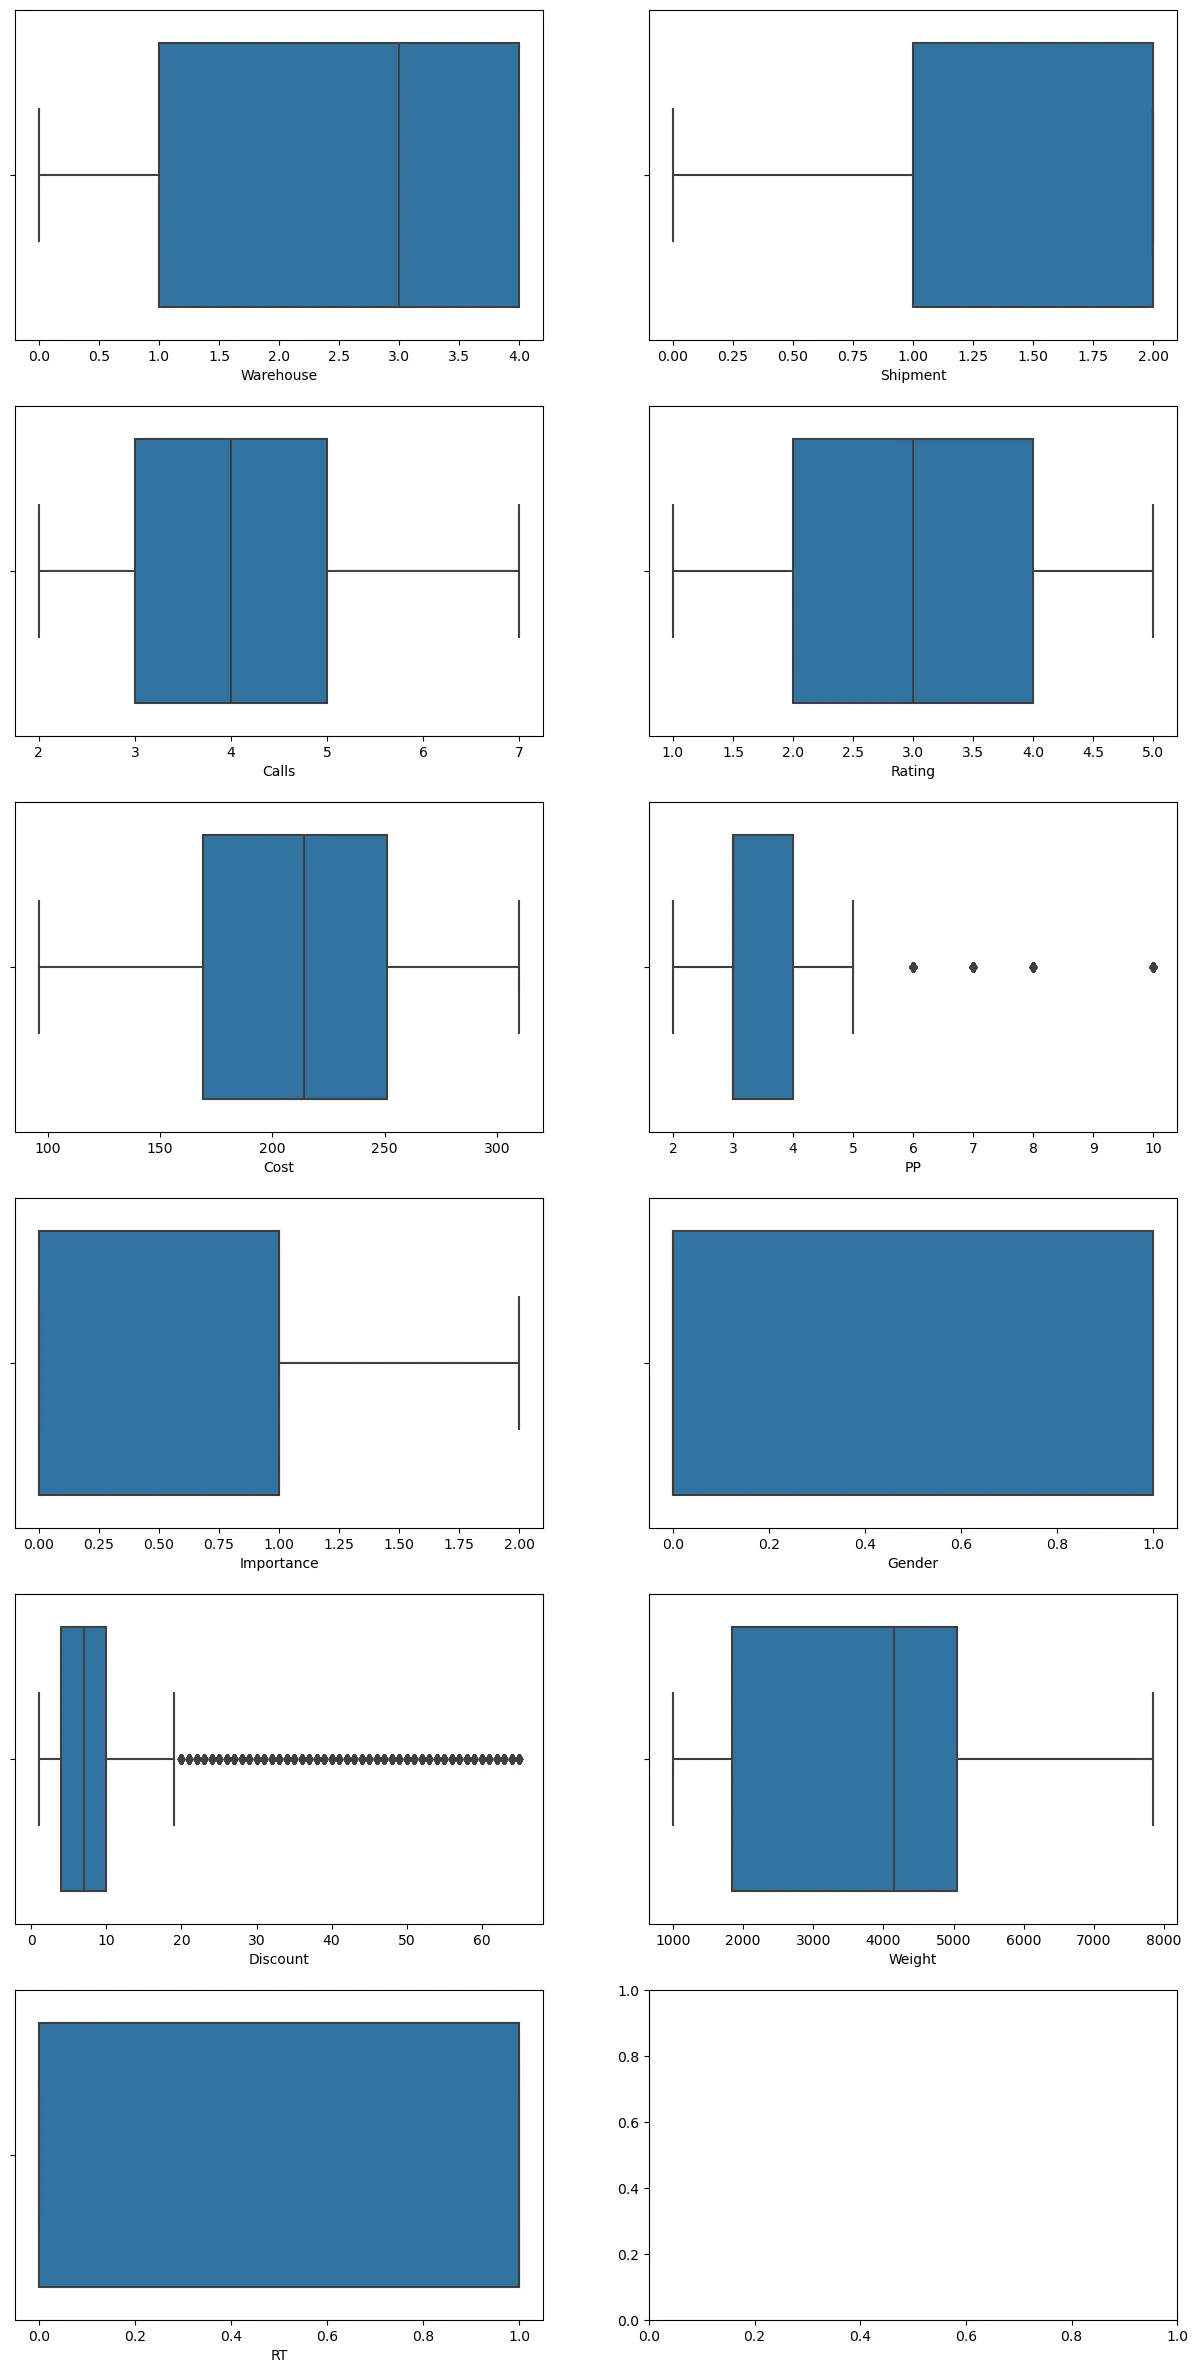
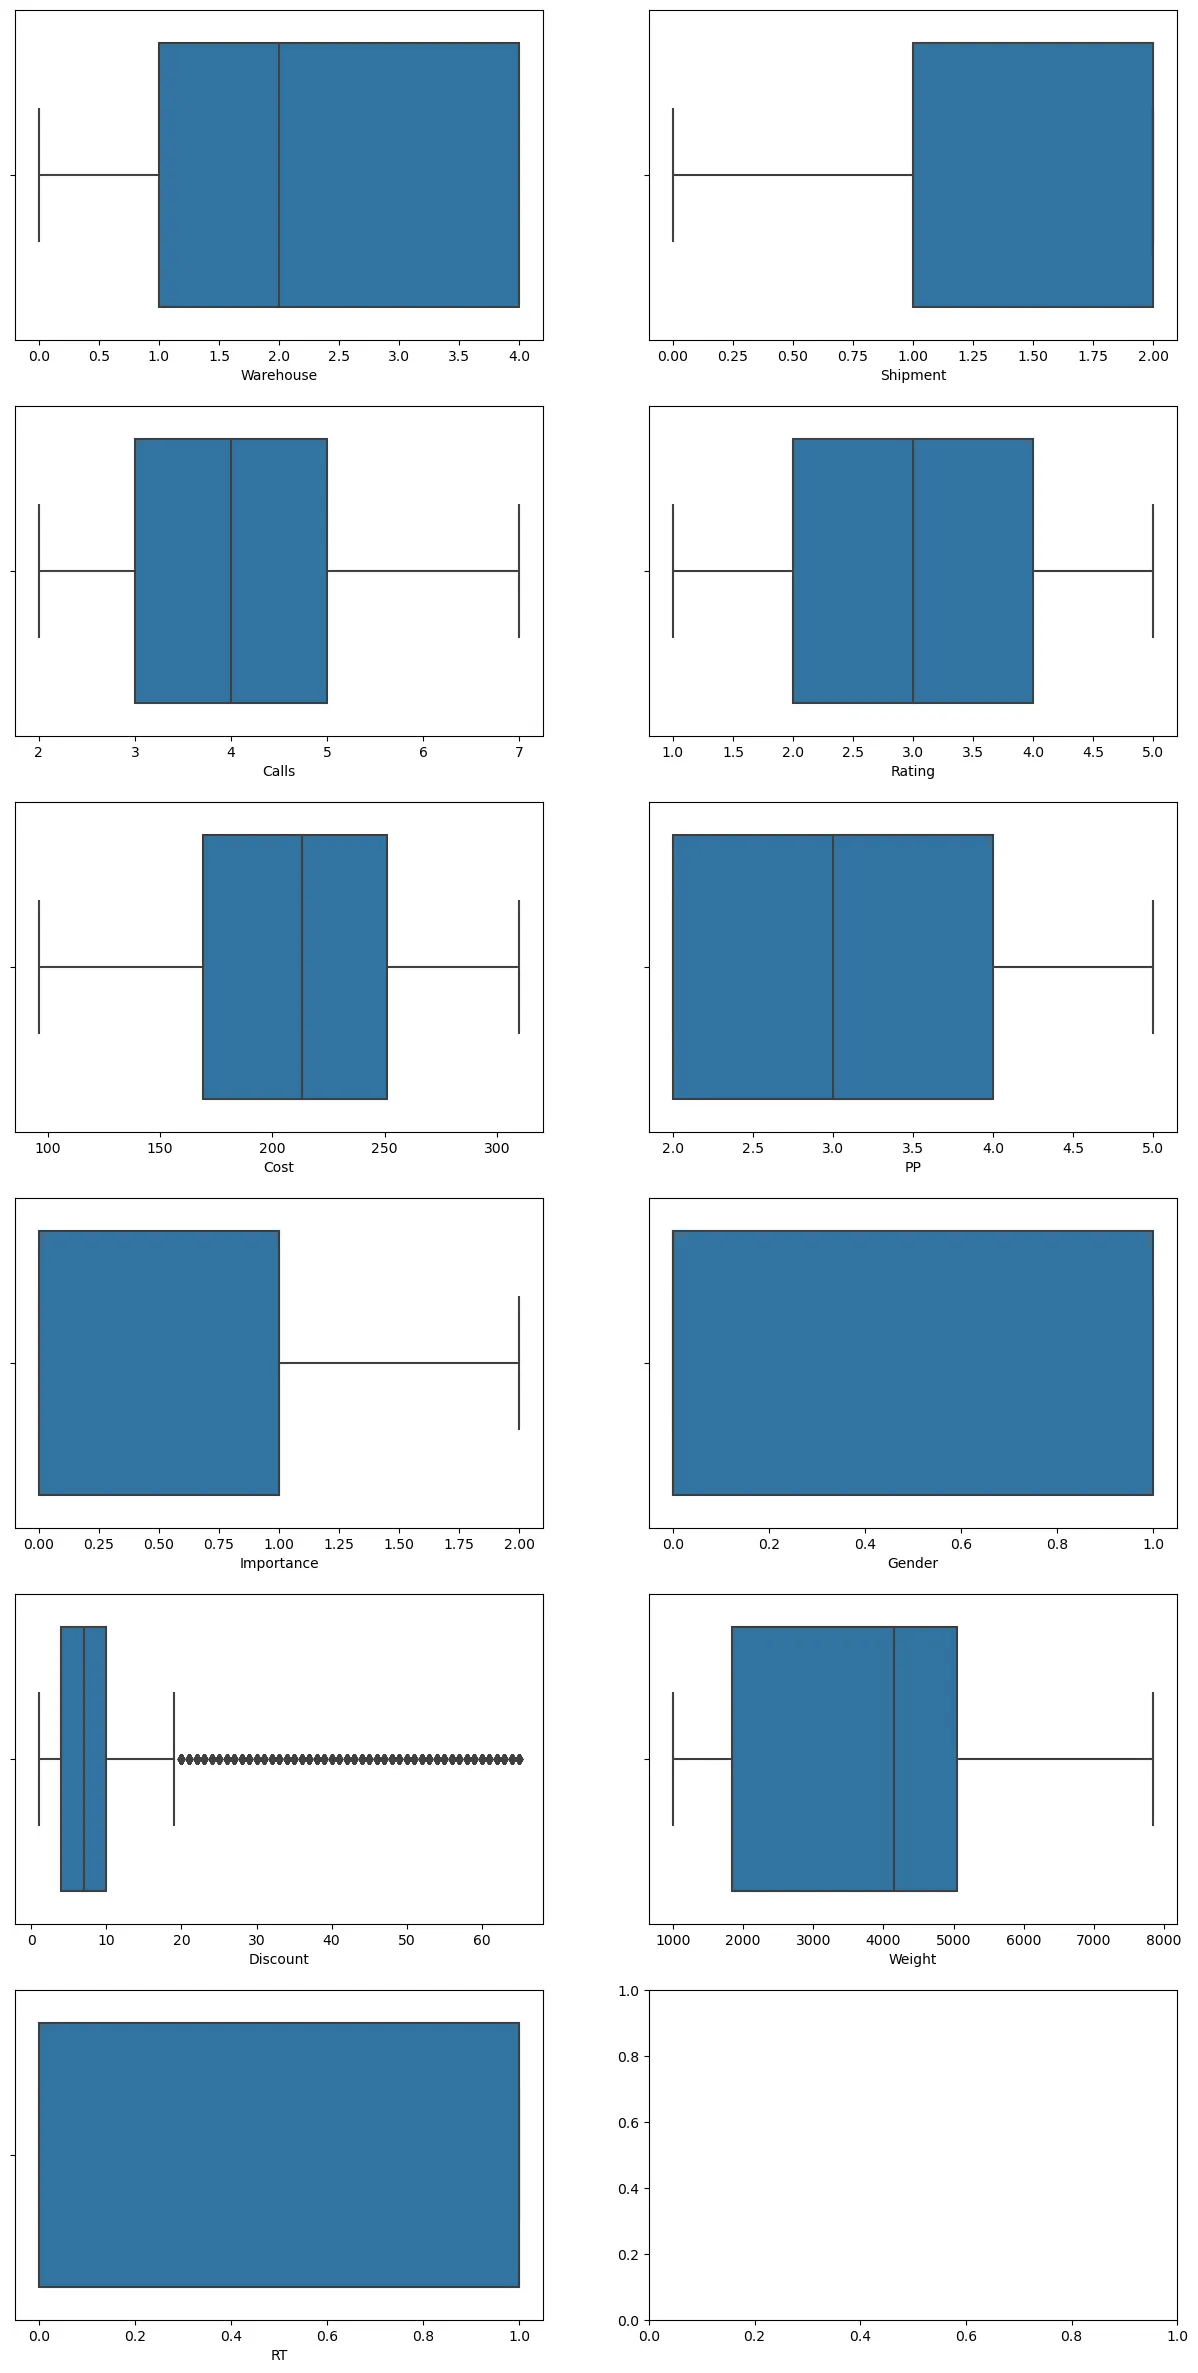
figure, ((ax1, ax2), (ax3, ax4), (ax5, ax6), (ax7, ax8), (ax9, ax10), (ax11, ax12)) = plt.subplots(nrows=6, ncols=2) #표를 넣을 4칸 생성
figure.set_size_inches(15, 30) # 각 표의 사이즈 정하기
sns.boxplot(x = "Warehouse", data = ec_data1, ax=ax1)
sns.boxplot(x = "Shipment", data = ec_data1, ax=ax2)
sns.boxplot(x = "Calls", data = ec_data1, ax=ax3)
sns.boxplot(x = "Rating", data = ec_data1, ax=ax4)
sns.boxplot(x = "Cost", data = ec_data1, ax=ax5)
sns.boxplot(x = "PP", data = ec_data1, ax=ax6)
sns.boxplot(x = "Importance", data = ec_data1, ax=ax7)
sns.boxplot(x = "Gender", data = ec_data1, ax=ax8)
sns.boxplot(x = "Discount", data = ec_data1, ax=ax9)
sns.boxplot(x = "Weight", data = ec_data1, ax=ax10)
sns.boxplot(x = "RT", data = ec_data1, ax=ax11)
Python
복사
PP의 이상치만 제거
ec_data1.describe()
Python
복사
ec_data2 = ec_data1[(ec_data1["PP"]<6)]
ec_data2
Python
복사
figure, ((ax1, ax2), (ax3, ax4), (ax5, ax6), (ax7, ax8), (ax9, ax10), (ax11, ax12)) = plt.subplots(nrows=6, ncols=2) #표를 넣을 4칸 생성
figure.set_size_inches(15, 30) # 각 표의 사이즈 정하기
sns.boxplot(x = "Warehouse", data = ec_data2, ax=ax1)
sns.boxplot(x = "Shipment", data = ec_data2, ax=ax2)
sns.boxplot(x = "Calls", data = ec_data2, ax=ax3)
sns.boxplot(x = "Rating", data = ec_data2, ax=ax4)
sns.boxplot(x = "Cost", data = ec_data2, ax=ax5)
sns.boxplot(x = "PP", data = ec_data2, ax=ax6)
sns.boxplot(x = "Importance", data = ec_data2, ax=ax7)
sns.boxplot(x = "Gender", data = ec_data2, ax=ax8)
sns.boxplot(x = "Discount", data = ec_data2, ax=ax9)
sns.boxplot(x = "Weight", data = ec_data2, ax=ax10)
sns.boxplot(x = "RT", data = ec_data2, ax=ax11)
Python
복사
4. 시각화
4-1. countplot
figure, ((ax1, ax2), (ax3, ax4), (ax5, ax6), (ax7, ax8)) = plt.subplots(nrows=4, ncols=2)
figure.set_size_inches(15, 20)
sns.countplot('Warehouse', data=ec_data2, ax=ax1)
sns.countplot('Shipment', data=ec_data2, ax=ax2)
sns.countplot('Calls', data=ec_data2, ax=ax3)
sns.countplot('Rating', data=ec_data2, ax=ax4)
sns.countplot('PP', data=ec_data2, ax=ax5)
sns.countplot('Importance', data=ec_data2, ax=ax6)
sns.countplot('Gender', data=ec_data2, ax=ax7)
sns.countplot('RT', data=ec_data2, ax=ax8)
Python
복사
•
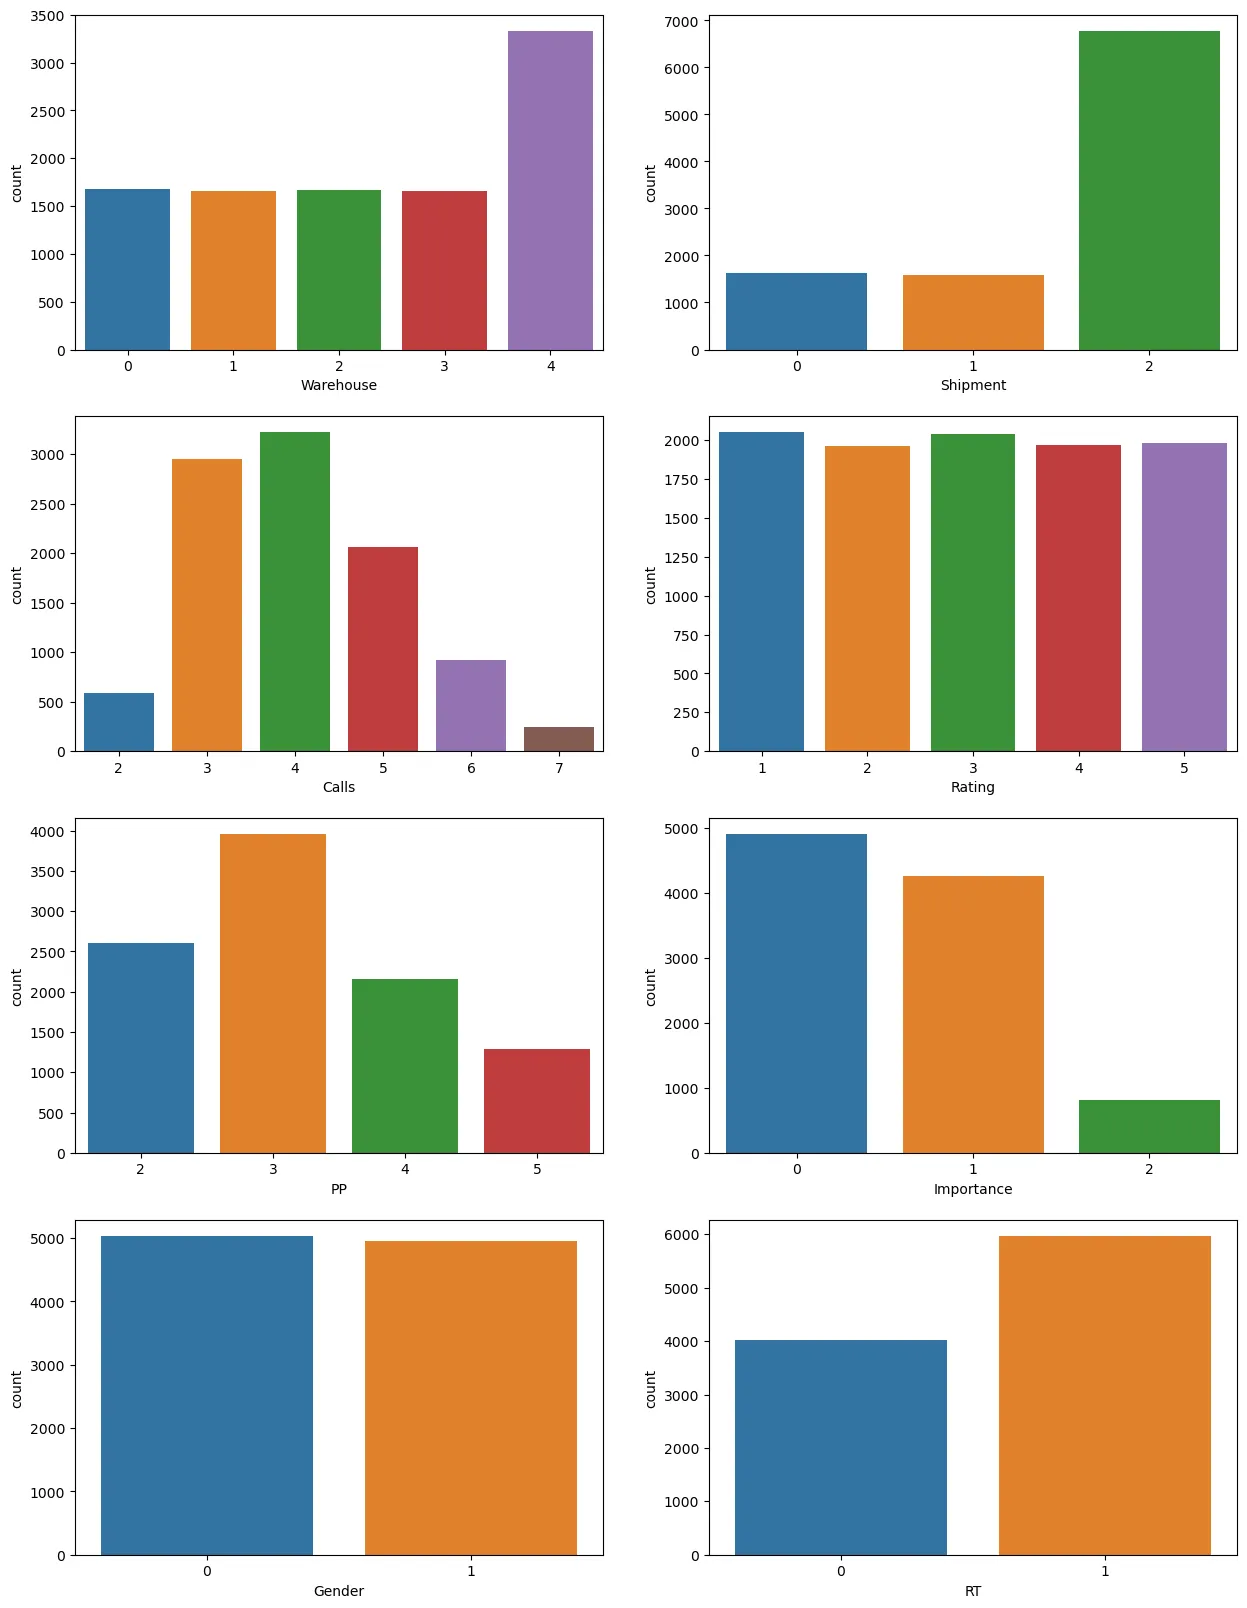
F창고에 물건이 가장 많고 나머지 창고는 고르게 분포한다.
•
배를 운송수단으로 이용하는 경우가 가장 많다.
•
한 물품에 대한 문의전화는 보통 3~5건 정도 온다.
•
고객 평가는 1점부터 5점까지 골고루 분포한다.
•
한 물품당 이전 거래횟수는 3회가 가장 많다.
•
중요도가 높은 물품은 별로 없다.
•
제품이 정시에 도착하지 않는 경우가 더 많다.
4-2. violinplot
figure, ((ax1, ax2)) = plt.subplots(nrows=1, ncols=2)
figure.set_size_inches(15, 10)
sns.violinplot('Importance', 'Shipment', hue='RT', split=True, data=ec_data2, ax=ax1)
sns.violinplot('Importance', 'Calls', hue='RT', split=True, data=ec_data2, ax=ax2)
Python
복사
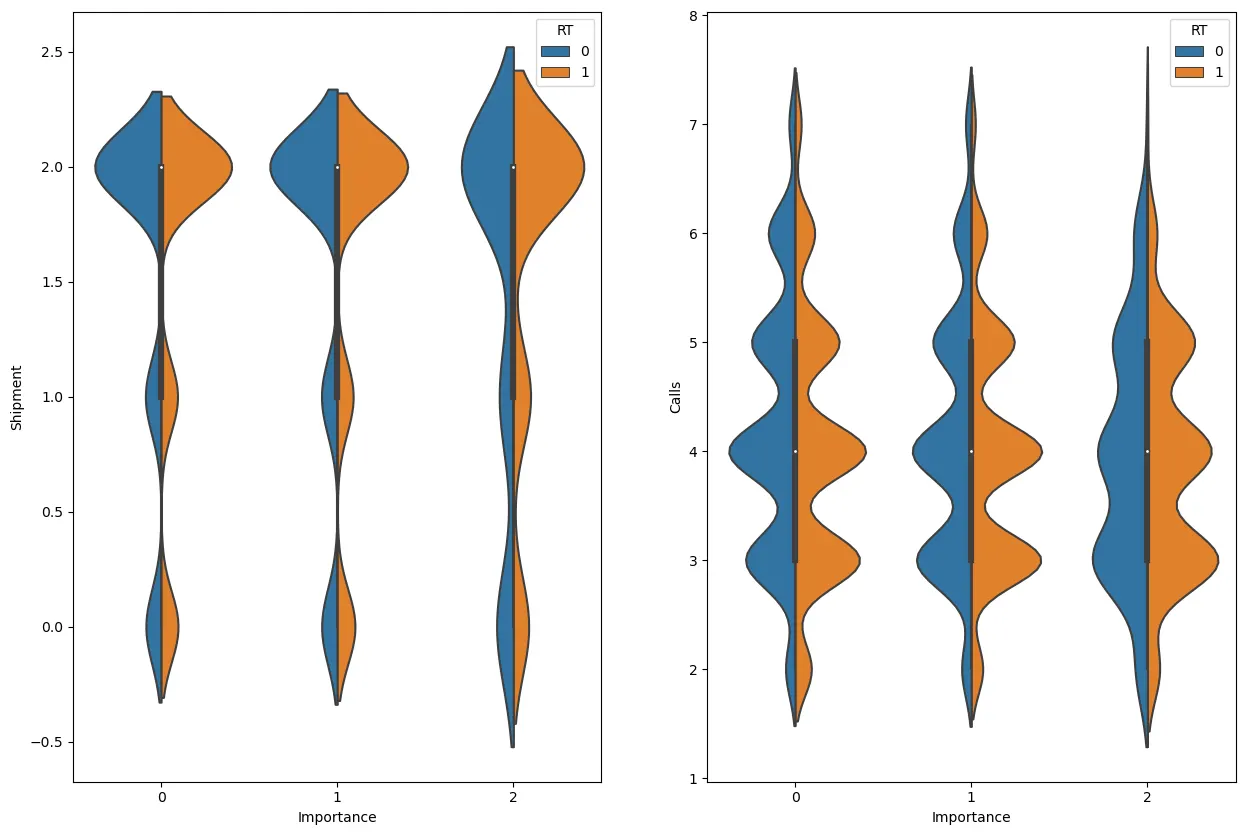
항공(0), 지상(1)보다 배를 통해서 운송된 물품들이 더 늦게 도착할 확률이 높았다.
위 countplot으로 본 문의전화 횟수의 비율과 violinplot의 문의전화 횟수에 따른 RT 비율을 보면 어느정도 상관관계가 있는 것을 알 수 있다.
5. 상관분석
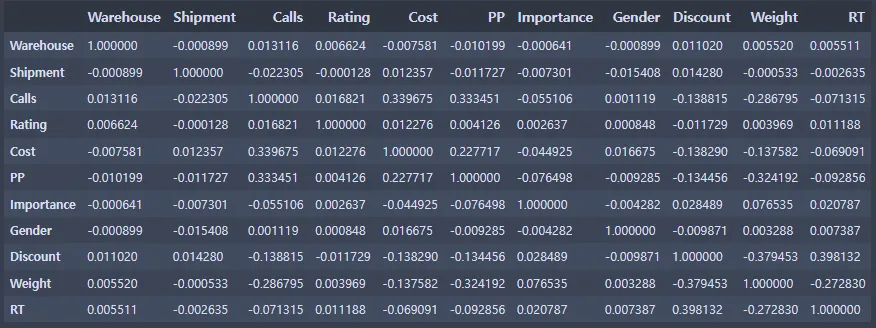
corrMatt = ec_data2[['Warehouse', 'Shipment', 'Calls', 'Rating', 'Cost', 'PP', 'Importance', 'Gender', 'Discount', 'Weight', 'RT']]
corrMatt = corrMatt.corr()
corrMatt
Python
복사
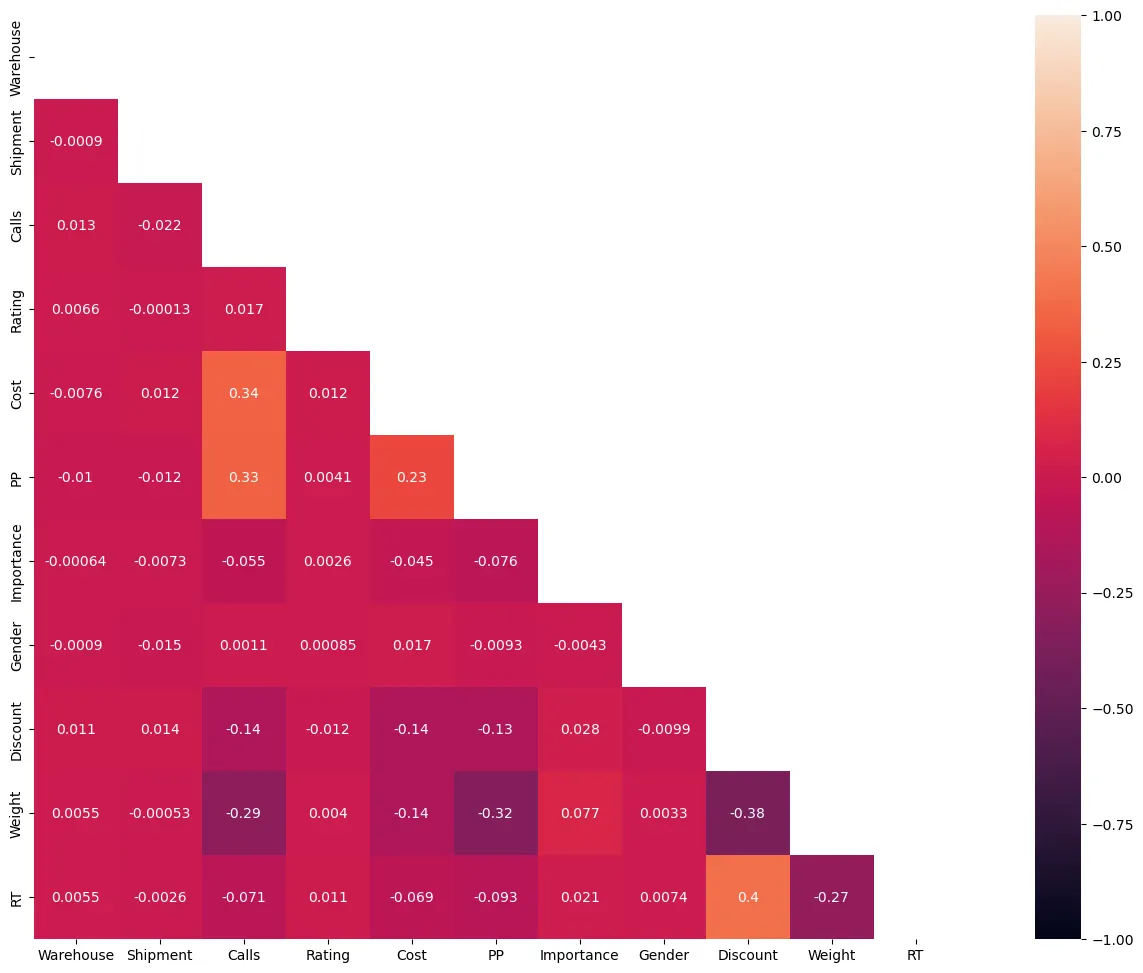
mask=np.zeros_like(corrMatt, dtype=np.bool)
mask[np.triu_indices_from(mask)] = True
figure, ax = plt.subplots()
figure.set_size_inches(20, 12)
sns.heatmap(corrMatt, mask=mask, vmin=-1, vmax=1, square=True, annot=True)
Python
복사


